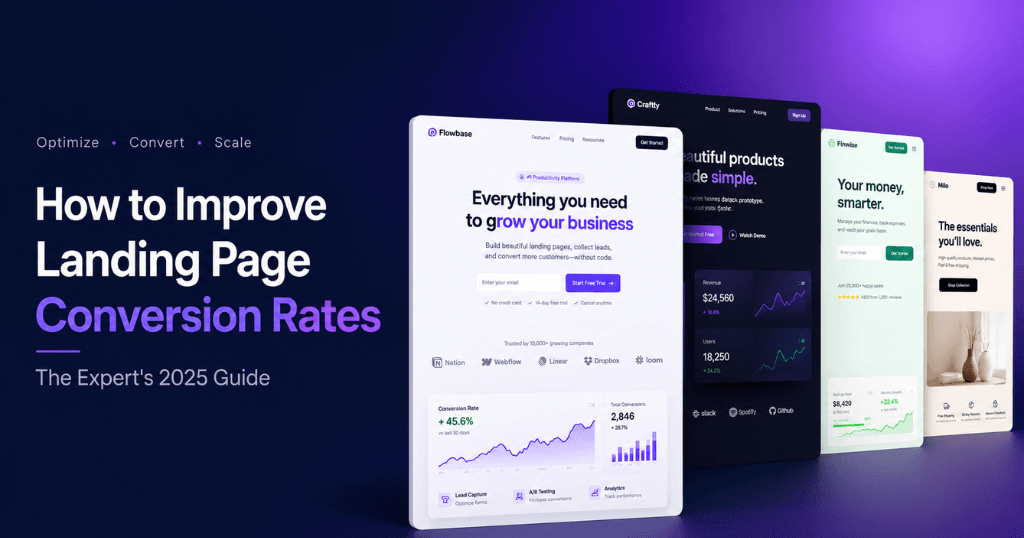
Improving landing page conversion rates comes down to one discipline: systematically reducing the psychological distance between a visitor’s arrival intent and the action you’re asking them to take. Every element that creates confusion, doubt, friction, or distraction widens that distance — and every element that creates clarity, trust, relevance, and momentum closes it.
This guide approaches conversion rate optimization (CRO) differently from most. Rather than listing design tips in isolation, it builds a complete mental model for understanding why visitors convert or don’t — then translates that model into a prioritized, testable system. Whether you’re managing landing pages yourself or working with a PPC agency in Chennai, this framework turns CRO from guesswork into a compounding operational system.
The Conversion Rate Gap: Where Most Businesses Are Losing Revenue Right Now
The difference between an average landing page and a high-performing one is not a small competitive advantage — it’s the difference between a business that scales profitably and one that struggles to justify its ad spend.
The industry benchmarks tell the story starkly. According to WordStream’s 2024 industry data, the average landing page conversion rate across all sectors sits at 2.35%. The top quartile of advertisers converts at 5.31%. The elite top 10% convert at 11.45% or higher. These aren’t different industries or different budgets — they’re often the same keywords, same ad platforms, and similar audiences. The variable is the landing page.
Put the math into practical terms: if a business spends ₹3,00,000 per month on Google Ads generating 3,000 clicks at ₹100 CPC:
| Conversion Rate | Monthly Leads | Cost Per Lead |
|---|---|---|
| 2.35% (Average) | 70 leads | ₹4,285 |
| 5.31% (Top 25%) | 159 leads | ₹1,887 |
| 11.45% (Top 10%) | 343 leads | ₹874 |
The top 10% is generating 4.9x more leads from the same spend. Without touching targeting, without changing the ad copy, without increasing the budget by a single rupee.
This is why a performance marketing agency in Chennai that understands CRO treats landing page optimization as inseparable from paid campaign management — because the page is where ad spend is converted into revenue, not the ad.
Additional supporting data points:
- Forrester Research found every $1 invested in CRO generates an average $100 return — a 9,900% ROI
- Google data shows a 1-second improvement in mobile page speed improves conversion rates by up to 27%
- Econsultancy’s 2024 CRO Report found that only 22% of businesses are satisfied with their conversion rates — meaning 78% are leaving significant revenue on the table
The Conversion Readiness Score: Diagnosing Your Page Before Optimizing It
Before implementing any changes, run your landing page through a structured diagnostic framework. The Conversion Readiness Score (CRS) evaluates your page across five dimensions, each scored 1–10:
| Dimension | Scoring Question | Weight |
|---|---|---|
| Relevance | Does the page precisely match the intent of the visitor? | 25% |
| Clarity | Can a visitor understand what they’ll get and how in 5 seconds? | 20% |
| Credibility | Does the page provide sufficient trust signals to overcome skepticism? | 20% |
| Motivation | Does the page create a compelling reason to act now? | 20% |
| Ease | Is the conversion action as frictionless as possible? | 15% |
Score your page honestly on each dimension. The dimension with the lowest score is your highest-priority optimization target. Most pages have a single dominant failure mode — addressing it first produces the largest conversion gain before any other change.
How to self-assess each dimension:
- Relevance: Show your landing page to 5 people who match your target audience and ask “Does this feel like what you’d expect to find after clicking [your ad headline]?” — If fewer than 4 say yes, relevance is your problem.
- Clarity: The 5-second test — after viewing only the above-the-fold section for 5 seconds, can they state what the page offers, who it’s for, and what to do next? (Use UsabilityHub or Maze for structured testing)
- Credibility: Count your trust signals — third-party reviews, client names/logos, specific results, team photos, security badges, contact information. If fewer than 4 are present and visible, credibility is the gap.
- Motivation: Is there any reason to act today rather than tomorrow? Time-bound offers, limited availability, cost-of-delay framing, or urgency based on genuine scarcity all increase motivation.
- Ease: Complete your own conversion form on mobile. Count how long it takes and how many fields you fill out. If it takes more than 90 seconds or requires more than 4 fields, ease is the problem.
The Relevance Principle: Why Your Ads and Pages Must Speak the Same Language
Relevance is the most important conversion dimension — and the one most commonly broken by the gap between ad teams and landing page teams operating independently.
Message match — the alignment between ad copy and landing page copy — is documented by Unbounce as producing conversion rate improvements of up to 212% when improved. This makes it the single highest-impact, lowest-cost optimization available to most advertisers.
The 3 Levels of Message Match
Level 1: Keyword Match (Basic) The keyword from the ad appears in the landing page headline. A visitor who clicked “Google Ads management Chennai” sees “Google Ads Management for Chennai Businesses” on arrival. Minimum viable relevance.
Level 2: Intent Match (Intermediate) The emotional intent of the ad — the promise, the angle, the specific outcome — is mirrored on the landing page. A visitor who clicked an ad promising “Lower Your Cost Per Lead in 30 Days” doesn’t just see the keyword — they see that specific promise reflected in the headline: “Reduce Your Cost Per Lead by 30–50% in the First 30 Days.”
Level 3: Audience Match (Advanced) The page copy reflects an understanding of the visitor’s specific situation, not just their search query. A visitor who clicked from a remarketing audience of “visitors who viewed pricing page but didn’t convert” sees copy that addresses the likely reason they hesitated — not the same generic copy shown to cold traffic.
Level 3 is achievable through dynamic text replacement (DTR) tools built into platforms like Unbounce, Instapage, and Webflow — where page copy updates automatically based on the visitor’s traffic source, query, or audience segment.
Practical message match audit: Open your top 5 paid ads in one browser tab and their destination landing pages in another. Read the ad, then immediately read the landing page headline. Does the landing page feel like a direct fulfillment of the ad’s promise? If you feel any discontinuity, your visitors feel it too — they just don’t give you feedback; they simply leave.
The Clarity Principle: Designing for Instant Comprehension
Clarity failures happen at two levels: structural clarity (the page’s information hierarchy isn’t logical or scannable) and message clarity (the value proposition requires too much effort to understand).
The Visual Hierarchy Framework for Landing Page Clarity
Human eyes don’t read landing pages — they scan them. According to Nielsen Norman Group’s eye-tracking research, website visitors read in an F-pattern (horizontal scan across the top, then down the left side) or a Z-pattern (diagonal sweep across main content blocks). Content placed outside these scan paths is largely missed.
Designing for the scan pattern:
- Headline at top-center or top-left: This is the first element the eye lands on — it must state the core value proposition
- CTA at top-right or center: The natural endpoint of the Z-pattern horizontal scan
- Benefit bullets in the left column: The F-pattern reads down the left side after the initial horizontal scan
- Social proof across the full width: Wide elements interrupt the scan and demand attention — ideal for trust-building content
- Secondary CTA at the bottom-center: Captures the visitors who read through to the end
Clarity checklist for above-the-fold content:
- [ ] Headline states the outcome, not the process
- [ ] Subheadline answers “How specifically?” and “For whom?”
- [ ] CTA button label tells visitors what they receive (not “Submit” — but “Get My Free Audit”)
- [ ] Supporting visual shows outcome or social context (not abstract or decorative)
- [ ] No navigation menu (removes exit paths from dedicated landing pages)
- [ ] No competing CTAs in the hero section
The Jargon Test
A frequently overlooked clarity problem: landing pages written in industry language that the audience doesn’t yet use. A business owner searching “how to get more leads from Google Ads” doesn’t necessarily understand “performance max campaigns,” “ROAS optimization,” or “smart bidding strategies.” Copy written in expert vocabulary to an audience who thinks in layperson terms creates a comprehension gap that kills conversion.
Test: replace every industry term with the plainest possible English equivalent and see if the meaning survives. If it does, use the plain English version.
The Credibility Architecture: Engineering Trust at Every Scroll Depth
Trust is not binary on landing pages — it’s accumulated in layers as the visitor scrolls. A visitor who finds your headline compelling will scroll if they’re curious, but each section of the page either adds to their trust bank or withdraws from it.
The architecture of trust on a landing page follows a specific sequence that mirrors the psychological stages of a skeptical buyer:
Stage 1 (Above the fold): “Is this relevant and credible enough to keep reading?” → Trust requirement: Logo/name recognition, a credible headline, and at least one visible trust signal (star rating, recognizable client logo, years in business)
Stage 2 (First scroll): “What specifically do I get, and is the claim believable?” → Trust requirement: Specific benefit statements (with numbers and timeframes), supporting evidence (statistics, case study snippet), and a visible social proof element
Stage 3 (Second scroll): “Who else has done this, and did it work for them?” → Trust requirement: Named, specific testimonials with measurable results; client logos if B2B; review badges if B2C; case study reference
Stage 4 (Third scroll): “What exactly happens when I submit, and is it safe?” → Trust requirement: Process transparency (what happens after they fill out the form), privacy assurance, security indicators, and contact information proving a real business exists
Stage 5 (Form area): “Am I comfortable with this final commitment?” → Trust requirement: Final social proof adjacent to the form, response time commitment, risk reversal (money-back guarantee, no lock-in, free cancellation)
The Specific Testimonial Formula
Generic testimonials (“Great service, highly recommended!” — Anonymous) generate near-zero trust. Specific testimonials create genuine conviction. The formula for a high-converting testimonial:
[Specific problem before] + [Specific action taken] + [Specific measurable result] + [Timeframe] + [Full name, title, company]
Example:
“We were getting 14 leads a month from Google Ads and spending ₹1.8L to get them. Weboin rebuilt our campaign structure in the first month, added negative keywords we’d never considered, and redesigned our landing page. 90 days later we’re at 47 leads on the same budget. Cost per lead dropped from ₹12,857 to ₹3,829.” — Priya M., Founder, Chennai-based EdTech company
This testimonial contains: a before state (14 leads, ₹1.8L), specific actions (rebuilt campaign structure, added negative keywords, redesigned landing page), a precise after state (47 leads, same budget), a timeframe (90 days), and full attribution.
The Motivation Layer: Why “Good Enough” Information Isn’t Enough to Convert
A visitor who fully understands your offer and completely trusts your brand still might not convert — because they haven’t been given a compelling reason to act today rather than next week, next month, or “sometime.”
This is the motivation problem — and it’s particularly acute in service businesses where the visitor faces no immediate pain forcing a decision.
The Four Motivation Mechanisms for Landing Pages
Mechanism 1: Time-Bound Scarcity A genuine deadline creates motivation that no amount of persuasive copy can match. The key word is genuine — fabricated countdown timers that reset when the page is refreshed are visually detectable by most visitors and actively damage trust when noticed.
Genuine time-bound offers:
- Monthly intake limits (“We onboard a maximum of 6 new clients per month — 2 spots remaining in June”)
- Promotional pricing with a real end date (“Free setup fee until May 31st — regular price ₹25,000”)
- Early-bird access for new product/service launches
Mechanism 2: Cost of Inaction Framing Rather than emphasizing what the visitor gains from acting, emphasize what they lose from not acting. This activates loss aversion — the psychological principle (documented by Nobel laureate Daniel Kahneman) that losses are felt roughly twice as intensely as equivalent gains.
Implementation: “Every month without optimized campaigns costs the average Chennai business ₹60,000–₹1,20,000 in wasted ad spend. Here’s how to calculate what you’re losing.”
Mechanism 3: Risk Reversal The most common reason visitors don’t convert when they want to is perceived risk — “What if it doesn’t work? What if I’m locked in? What if I waste money?” Explicit risk reversal removes the primary psychological barrier to action.
Strong risk reversals:
- “If we don’t reduce your cost per lead in 60 days, we work free until we do”
- “Month-to-month contracts — cancel anytime with 30 days notice”
- “Free for the first 14 days — no credit card required”
- “We don’t get paid until you see results” (performance-based models)
Mechanism 4: Social Momentum Showing that others like the visitor are already taking action creates bandwagon motivation. This is distinct from general social proof (testimonials) — it’s specifically about creating FOMO through volume and recency.
Implementation: “Over 40 Chennai businesses booked a free audit last month” or a live counter showing current signups.
The Ease Principle: Friction Is the Enemy of Conversion
Ease is the final conversion dimension — and it’s the one where the accumulated psychology of desire, trust, and motivation either delivers a conversion or loses it at the final step.
Every millisecond of load time, every extra form field, every confusing CTA, and every mobile layout that requires pinching and zooming is friction — and friction kills conversions that were otherwise won.
Form Conversion Science: The Data on Field Reduction
The relationship between form length and conversion rate is among the most rigorously studied in CRO research:
| Number of Form Fields | Typical Conversion Rate Impact |
|---|---|
| 1–2 fields | Highest conversion rate (use for early-stage lead capture) |
| 3–4 fields | Optimal balance for most service lead generation |
| 5–6 fields | Conversion rate decline begins — each field costs approximately 10% |
| 7–9 fields | Significant decline — typically 40–60% lower than 3-field forms |
| 10+ fields | High drop-off; consider multi-step form format |
Source: HubSpot analysis of 40,000+ landing page forms.
The progressive profiling alternative: Rather than collecting all needed information upfront (which kills conversion), collect the minimum required to initiate contact, then gather additional information through follow-up questions over subsequent interactions. Most service businesses only need name + phone or email to have a first conversation.
Mobile Conversion Friction Points (Specific to Indian Markets)
India’s mobile internet penetration and usage patterns create specific mobile conversion considerations that generic CRO advice often misses:
- Network variability: 4G/5G penetration varies significantly by geography. Pages that load reliably at 10 Mbps may struggle at 2 Mbps. Target LCP under 2.5 seconds on a simulated 3G network for maximum coverage.
- Phone number as primary contact: Indian business buyers often prefer WhatsApp contact over form submissions. Adding a WhatsApp CTA alongside the primary form (“Or chat with us on WhatsApp”) frequently increases total conversions by 20–35%.
- UPI and payment trust: For e-commerce landing pages, displaying UPI, Razorpay, and PayTM logos as trusted payment methods improves checkout conversion by reducing payment uncertainty.
- Regional language options: For B2C targeting Tamil Nadu markets specifically, offering Tamil language versions of key pages significantly increases conversion for audiences who aren’t fully comfortable reading English.
The Testing Architecture: Building a System That Compounds Conversion Gains
Isolated optimizations produce isolated improvements. A systematic testing architecture produces compounding improvements — because each validated learning becomes the baseline against which the next test is measured, and the organization accumulates a proprietary knowledge base about its specific audience’s psychology.
The ICE Scoring System for Test Prioritization
Before running any A/B test, prioritize using the ICE scoring system (a widely used alternative to PIE that emphasizes impact and confidence):
- Impact (1–10): How significantly will this change conversion rate if it works?
- Confidence (1–10): How confident are we, based on data and research, that this will work?
- Ease (1–10): How quickly and easily can this be implemented and tested?
ICE Score = (Impact + Confidence + Ease) / 3
Always test the highest ICE score items first. This ensures resources go to changes most likely to produce significant results quickly.
The Conversion Testing Ladder
Structure tests in a logical sequence — testing highest-impact elements before lower-impact ones:
Rung 1 — Offer Tests (Highest Impact) Test different offers entirely: Free audit vs. free consultation vs. free report vs. free trial. The offer itself has more conversion impact than any single design element.
Rung 2 — Headline Tests (Very High Impact) Test fundamentally different value propositions, not just word tweaks. “Double Your Leads” vs. “Halve Your Cost Per Lead” — same mathematical outcome, different psychological framing, dramatically different conversion results.
Rung 3 — CTA Tests (High Impact) Test CTA copy, color, size, and placement in combination. The CTA system (button + surrounding copy + form) acts as a unit — test it as a unit.
Rung 4 — Social Proof Tests (High Impact) Test testimonial format (text vs. video), testimonial specificity (generic vs. result-focused), social proof type (testimonials vs. logos vs. review ratings), and placement (above fold vs. mid-page vs. adjacent to form).
Rung 5 — Page Structure Tests (Medium Impact) Long-form vs. short-form, one-column vs. two-column, single vs. multiple CTAs.
Rung 6 — Design Element Tests (Lower Impact) Color schemes, typography, image selection, whitespace. These rarely move the needle as dramatically as Rungs 1–4 — run them only after higher-impact tests have been validated.
Statistical Validity: The Non-Negotiable Standard
Every conversion test must meet three statistical validity requirements before results are acted upon:
- Minimum sample size: Use a significance calculator (Optimizely’s free tool, AB Testguide.com) to determine the sample size required for 95% confidence given your current conversion rate and expected minimum detectable effect. For a 3% baseline conversion rate, testing a change expected to produce a 20% relative improvement (to 3.6%) requires approximately 4,700 visitors per variant.
- Minimum duration: Run every test for a minimum of 7 days — ideally 14 — to account for day-of-week variation in traffic behavior and quality. Tests concluded after 2–3 days are frequently wrong because early traffic often skews toward specific audience segments.
- One variable at a time: The fundamental rule. Testing headline AND CTA AND image simultaneously produces a result, but not an insight — you can’t know which change drove the result. Insights are what compound. Results alone are consumed once.
Tools for structured A/B testing:
- VWO (Visual Website Optimizer): Full-featured A/B, multivariate, and split URL testing with heatmaps
- Optimizely: Enterprise-grade with sophisticated audience targeting
- Unbounce / Instapage: Landing page builders with native A/B testing
- Google Analytics 4 Experiments: Free, requires technical setup but deeply integrated
- Hotjar: Heatmaps and session recordings for qualitative insight generation before formal testing
Platform-Specific Landing Page Optimization: Google Ads vs. Meta Ads
Landing pages should be optimized differently depending on the traffic source — because visitor intent, psychological state, and expectation vary significantly between search and social traffic.
Google Search Ad Landing Pages: Optimizing for High-Intent Traffic
Visitors from Google Search have declared their intent through the search query. They know what they’re looking for and are actively evaluating options. The landing page’s job is to confirm they’ve found the best option and make conversion as easy as possible.
Google Search landing page priorities:
- Maximum message match with the query and ad — the closer the page mirrors the exact words of the search, the more the visitor feels they’ve found precisely what they sought
- Proof of competence — portfolios, case studies, client logos, and certifications for a digital marketing agency in Chennai audience specifically looking for a qualified partner
- Differentiators from competition — search visitors are evaluating multiple tabs simultaneously; clear differentiators (specialization, pricing model, results data) help you win the comparison
- Quality Score optimization — Google’s Quality Score (1–10 per keyword) includes Landing Page Experience as a component. Better landing pages = higher Quality Score = lower CPCs. A digital marketing company in Chennai managing Google Ads that ignores landing page quality is paying a CPC premium on every click.
Quality Score impact on CPC:
| Quality Score | CPC Adjustment vs. QS 6 (Average) |
|---|---|
| 10 (Excellent) | -50% |
| 8–9 (Great) | -25% to -33% |
| 7 (Good) | -17% |
| 6 (Average) | 0% |
| 5 (Below Average) | +25% |
| 3–4 (Poor) | +50% to +100% |
| 1–2 (Very Poor) | +200% to +400% |
A Quality Score improvement from 5 to 8 — achievable through landing page optimization — reduces CPC by 40%. On ₹3 lakhs monthly spend, that’s ₹1.2 lakhs in monthly savings, while simultaneously generating more leads from better conversion rates.
Meta Ad Landing Pages: Converting Interrupted Attention
Meta (Facebook and Instagram) visitors were not looking for your product — they were shown it while doing something else. Their psychological state is fundamentally different: passive consumption interrupted by your ad, rather than active intent-driven searching.
Meta ad landing page priorities:
- Emotional hook above the fold — you have 1–2 seconds before they scroll; lead with an emotional trigger (aspirational outcome, relatable problem, social proof) rather than a logical argument
- Shorter form pages — meta traffic often has lower immediate intent; shorter pages with a lower-commitment initial offer (free resource, quiz, free consultation) convert better than long-form sales pages
- Video or visual social proof — meta audiences have been trained to trust peer validation; video testimonials and UGC-style social proof convert significantly better than text
- Retargeting-specific pages — warm audiences who’ve already seen your ad or visited your website deserve copy that acknowledges their previous exposure: “Still thinking about reducing your ad spend? Here’s what 3 months with Weboin looks like for a business like yours.”
How Weboin Builds Landing Pages That Convert for PPC Clients
At Weboin, a specialized performance marketing agency in Chennai, landing page optimization is embedded into every PPC engagement from day one — because ad spend and page performance are two sides of the same revenue equation.
Our integrated approach covers:
Conversion Audit (Week 1): Every new client engagement begins with a full audit of existing landing pages using our 40-point Conversion Readiness Score framework. We identify the dominant failure mode — whether it’s relevance, clarity, credibility, motivation, or ease — and prioritize accordingly.
Qualitative Research (Week 1–2): We install Microsoft Clarity (free heatmap and session recording tool) on all landing pages to capture actual visitor behavior. Heatmaps show where visitors click and where they stop scrolling. Session recordings reveal where they hesitate, rage-click, or abandon. Form analytics show which fields cause the most drop-off. This qualitative layer informs every hypothesis we test.
Landing Page Build or Redesign (Week 2–4): Where existing pages can’t be adequately optimized, we build dedicated conversion-focused landing pages for each campaign — one page per offer, per audience segment, per traffic source. Message match is built in from the brief stage.
Testing Infrastructure Setup: Before any optimization goes live, we configure proper A/B testing with statistical significance tracking, ensure all conversion events are firing correctly in GA4 and each ad platform, and establish ICE-scored testing roadmap for the first 90 days.
Continuous Iteration: CRO is not a project — it’s a program. We review test results bi-weekly, update the testing roadmap monthly, and compound conversion gains across every campaign we manage.
Typical outcomes for digital marketing agency in Chennai clients who commit to a structured CRO program:
- 35–80% conversion rate improvement within the first 90 days
- 25–55% reduction in cost per lead from identical ad spend
- Quality Score improvements of 2–3 points across target keywords, reducing CPCs materially
- Measurable revenue attribution from improved conversion rates
The 60-Point Landing Page Optimization Checklist
RELEVANCE (Message Match)
- [ ] Page headline contains exact keyword or close variant from the ad
- [ ] Headline emotional promise mirrors the specific ad angle (not just keyword)
- [ ] Each major ad group has its own dedicated landing page (not a shared generic page)
- [ ] Retargeting audiences see different copy from cold traffic
CLARITY (Comprehension)
- [ ] 5-second test passed: offer, audience, and next step clear without reading body copy
- [ ] No navigation menu on the page (for paid traffic landing pages)
- [ ] One primary CTA only in the hero section
- [ ] Jargon replaced with audience-native language
- [ ] Benefit statements use outcomes, not features
- [ ] Visual hierarchy guides eye from headline → benefit → social proof → CTA
CREDIBILITY (Trust Architecture)
- [ ] Minimum 2 specific, attributed testimonials with measurable results
- [ ] Client logos visible without scrolling (if B2B)
- [ ] Star rating and review count displayed
- [ ] Third-party badge (Google, Clutch, G2) near primary CTA
- [ ] HTTPS confirmed (padlock visible in browser)
- [ ] Contact information (phone, email) visible in footer or header
- [ ] Real team photo or founder photo present
- [ ] Privacy policy linked near form
- [ ] No generic stock photography in hero (real photos preferred)
MOTIVATION (Urgency)
- [ ] At least one genuine urgency element present (genuine, not fake countdown)
- [ ] Cost of inaction stated explicitly or implied clearly
- [ ] Risk reversal statement adjacent to CTA (“No lock-in,” “Money-back guarantee”)
- [ ] Process clarity: visitor knows exactly what happens after they click
EASE (Friction Reduction)
- [ ] Form fields: maximum 4 for service lead gen
- [ ] CTA button copy is benefit-framed (not “Submit”)
- [ ] Form submit CTA is large enough to tap on mobile (minimum 44px height)
- [ ] Mobile layout tested at 375px — no horizontal scrolling
- [ ] LCP under 2.5 seconds on mobile (verified via PageSpeed Insights)
- [ ] WhatsApp CTA available alongside form (for Indian audiences)
- [ ] Appropriate keyboard type triggered for each form field (email, tel, text)
- [ ] Autocomplete enabled on name, email, phone fields
TECHNICAL
- [ ] Conversion event firing correctly in GA4
- [ ] Conversion event firing in Google Ads (for Quality Score)
- [ ] UTM parameters on all destination URLs for source attribution
- [ ] No render-blocking scripts slowing initial paint
- [ ] Canonical tag correct (for pages with similar variants)
- [ ] A/B testing tool installed and test configured (if applicable)
Frequently Asked Questions About Landing Page Conversion Rates
Message match — the alignment between your ad and your page headline — produces the largest documented single-element conversion improvement (up to 212% per Unbounce research). If you have limited time, fix message match before anything else.
Compare your landing page conversion rate against the same page's performance for different traffic sources in GA4. If organic traffic converts at 4% and paid traffic converts at 1%, the problem is likely message match or audience mismatch, not the page itself. If all traffic converts below 2%, the page is the problem.
Continuously — but with proper sequencing. After each winning test is declared, that variant becomes the new control and the next-priority test begins. On well-trafficked pages (1,000+ monthly conversions), you can run a complete test cycle every 2–4 weeks. On lower-traffic pages, prioritize higher-impact tests that require less traffic to reach significance.
Google's Quality Score directly affects CPC — a Quality Score of 10 can reduce your CPC by up to 50% compared to QS 5. Landing Page Experience is one of three Quality Score components. Improving your landing page relevance, clarity, and load speed directly reduces what you pay per click. This is one of the most underutilized cost reduction strategies available to advertisers.
Generally no. Google Search visitors have active intent; Meta visitors were interrupted. The optimal landing page for search traffic (intent-matching, comparison-focused, with differentiators) differs from the optimal page for social traffic (emotion-leading, shorter, with visual social proof). Using the same page for both is a compromise that underperforms for both.
When the cost of continued underperformance exceeds the cost of professional optimization — which for most businesses spending ₹1 lakh or more monthly on paid ads is immediate. A specialist PPC agency in Chennai like Weboin brings the diagnostic frameworks, testing infrastructure, qualitative research tools, and iterative methodology that produce systematic conversion improvement rather than one-off changes.
Final Thought: The Landing Page Is Your Best or Worst Salesperson
Every click that arrives on your landing page represents a person who was interested enough in your ad to take an action. They gave you their attention voluntarily. What happens next — whether they convert or leave — is almost entirely within your control.
A well-built, systematically tested landing page converts that attention into business consistently, predictably, and profitably. A poorly built page wastes the investment that brought visitors to it.
The conversion optimization framework in this guide — the Conversion Readiness Score, the five conversion dimensions, the ICE-prioritized testing ladder, the platform-specific strategies, and the 60-point checklist — gives you the complete system for treating your landing pages as the conversion engines they should be rather than the digital brochures they often are.
The gap between 2.35% and 11.45% is not luck or budget. It’s system, methodology, and the discipline to test continuously rather than to assume the current version is the best possible one.
Whether you optimize independently or work with a specialist digital marketing company in Chennai like Weboin, the framework is here. The only remaining variable is execution.
About Weboin: Weboin is a full-service digital marketing agency in Chennai specializing in PPC management, performance marketing, landing page conversion optimization, SEO, and web development. As a trusted PPC agency in Chennai and performance marketing agency in Chennai, Weboin helps businesses systematically improve landing page conversion rates — turning the same ad spend into significantly more leads, customers, and revenue.

No comment yet, add your voice below!