
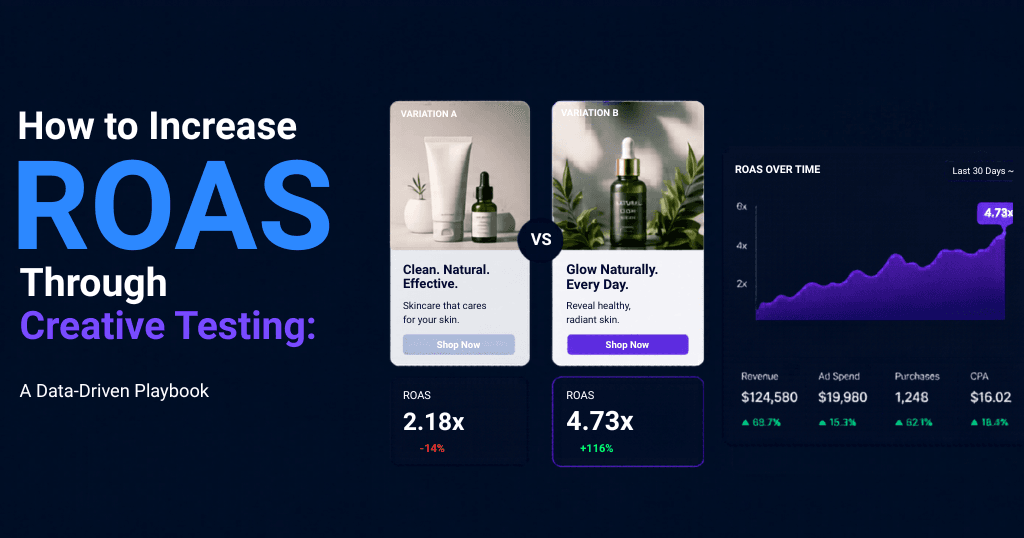
The fastest, most reliable way to increase ROAS is systematic creative testing — iterating on ad visuals, copy, and formats using structured experiments until you identify the combinations that convert at the lowest cost. According to Nielsen, creative quality is responsible for 49% of a campaign’s sales impact — more than targeting, reach, brand, or recency combined — which means optimizing creative is the single highest-leverage activity available to any performance marketing team.
This guide gives you the full framework: what to test, how to structure experiments, how to read results without being misled by data, and how to scale winners without killing them. Whether you manage campaigns in-house or partner with a performance marketing agency in Chennai, this is the creative testing playbook that separates 2x ROAS from 6x ROAS.
What Is Creative Testing and Why Does It Drive ROAS More Than Anything Else?
Creative testing is the systematic process of running controlled ad experiments to determine which visual, copy, format, or message variations produce the best business outcomes — lowest cost per acquisition (CPA), highest return on ad spend (ROAS), or highest click-through rate (CTR), depending on campaign objective.
It is distinct from “running multiple ads” — which most advertisers do — because it involves structured hypotheses, proper isolation of variables, statistical significance thresholds, and a documented learning system that accumulates insights over time.
Why creative — not targeting — is the primary ROAS lever:
Meta’s own algorithm has made audience targeting increasingly automated. With Advantage+ audiences, broad targeting, and Lookalike Audiences, the platform is doing much of the targeting work. The same is true of Google’s Performance Max and Smart Bidding. As targeting has become commoditized, creative differentiation has become the primary competitive advantage.
The data bears this out:
- Nielsen’s 2023 ROI report found creative accounts for 49% of sales impact in digital campaigns
- A Meta-commissioned study found that top-performing creative generates 3–5x more revenue per impression than median creative — for the same audience and budget
- According to Kantar, brands that regularly refresh and test creative see 30–50% lower ad fatigue decay rates than those running static creatives
- Smartly.io’s 2024 State of Social Advertising report found that advertisers running 5+ creative variants per ad set had 22% higher ROAS than those running 1–2 variants
The conclusion is unambiguous: more rigorous creative testing = higher ROAS, lower CPA, and more durable campaign performance.
The Creative Testing Framework: 5 Layers Every Test Must Address
A high-performing creative testing framework isn’t about randomly swapping images. It operates across five distinct layers, each tested in sequence to build a compounding understanding of what works.
Layer 1: Message / Angle Testing
Before testing visuals, test the message. The “angle” is the core idea or emotional frame around which the ad is built. Different audience segments respond to different angles for the same product or service.
Common high-performing angles:
| Angle Type | Core Idea | Best For |
|---|---|---|
| Problem-Solution | “You have X problem. We fix it.” | High-intent, problem-aware audiences |
| Social Proof | “12,000 brands trust us. Here’s why.” | Consideration stage, trust-building |
| Before/After | “This is what changed when they tried X.” | Visual products, transformational services |
| Fear/Loss Aversion | “Every day without X is costing you Y.” | High-stakes purchases, B2B |
| Aspiration | “Imagine your business at 5x growth.” | Early-stage, vision-driven audiences |
| Curiosity | “Most brands never discover this.” | Top-of-funnel awareness |
| Authority/Expert | “Here’s what 10 years of data shows.” | B2B, high-consideration services |
| Offer-Led | “Free audit. No obligation. Real results.” | Bottom-of-funnel, conversion campaigns |
For a PPC agency in Chennai running campaigns for a B2B client, the Problem-Solution and Authority angles typically outperform for cold audiences, while Offer-Led angles dominate retargeting. Testing which angle wins for each funnel stage is the most valuable experiment to run first.
How to test message angles:
- Create one static image or video for each angle — hold the visual format constant
- Run each angle as a separate ad set with identical audiences and budgets
- Measure by CPM-normalized CTR (clicks ÷ impressions × 1000) and cost per lead/purchase
- The winning angle becomes the foundation for all subsequent creative iterations
Layer 2: Hook Testing (Video and Static)
The hook is the first 1–3 seconds of a video ad, or the visual/headline combination in a static ad. It determines whether the audience stops scrolling or doesn’t.
Research by Meta found that 47% of the value of a video ad is delivered in the first 3 seconds. If the hook doesn’t land, the rest of the ad is irrelevant — the viewer is already gone.
Hook formats to test:
For video ads:
- Bold statement hook: “Your Google Ads are bleeding money right now.”
- Question hook: “Why are your competitors paying 40% less per lead?”
- Pattern interrupt hook: Unexpected visual or sound that breaks scroll behavior
- Story opener: “Six months ago, this brand was getting 8 leads a month…”
- Data hook: “83% of ad budgets are wasted. Here’s how to find yours.”
- Direct address: “If you’re a business owner in Chennai, you need to see this.”
For static ads:
- Headline-dominant vs. image-dominant layouts
- Text overlay vs. clean image
- Person/face in image vs. product/result in image
- Bold single claim vs. multiple benefit bullets
Testing structure for hooks: Keep the body copy, CTA, offer, and landing page identical across all hook variants. The only variable is the opening 3 seconds (video) or the above-the-fold visual element (static). This isolation is what makes the data meaningful.
Layer 3: Format Testing
Ad format — video vs. static, carousel vs. single image, short-form vs. long-form — varies in performance by platform, audience, and product category. There is no universally superior format. The correct answer is always “whichever your specific audience responds to” — and that requires testing.
Format performance benchmarks by platform:
| Format | Platform | Typical CTR Range | Best Use Case |
|---|---|---|---|
| Short video (6–15s) | Meta, YouTube | 1.5–3.5% | Brand awareness, hook testing |
| Long video (30–90s) | Meta, YouTube | 0.8–2.0% | Storytelling, high-consideration products |
| Static single image | Meta, Google Display | 0.5–1.5% | Retargeting, simple offers |
| Carousel | Meta, LinkedIn | 0.9–2.2% | Multi-product, step-by-step storytelling |
| UGC-style video | Meta, TikTok | 2.0–5.0% | D2C, consumer products, trust-building |
| Testimonial video | Meta, YouTube | 1.2–3.0% | Mid-funnel consideration |
| Dynamic product ads | Meta, Google | Variable | Retargeting with catalog |
| Responsive search ads | Google Search | 6–12% CTR | Search intent capture |
Key format testing insight: UGC (user-generated content) style ads — filmed on a phone, unpolished, first-person delivery — consistently outperform studio-produced creative on Meta and TikTok for consumer products. Smartly.io data shows UGC-style ads achieve 4x higher engagement rates than polished production ads on these platforms.
Layer 4: Visual Element Testing
Once you’ve identified a winning angle and format, drill into specific visual elements. Small changes here produce significant performance shifts.
Visual elements to test:
- Background color: Bright/bold vs. neutral vs. brand color
- Human face vs. no face: Ads with human faces in the primary visual generate higher emotional engagement — particularly when the subject is making direct eye contact with the camera
- Product in context vs. standalone: Lifestyle imagery (product being used) vs. product on white background
- Text overlay style: Bold headline text vs. subtle caption vs. no text overlay
- Color contrast: High-contrast ads stop the scroll more effectively on mobile
- Image composition: Subject centered vs. rule-of-thirds vs. asymmetric
A discipline worth adopting: Maintain a visual element “swipe file” — a documented record of which elements won in previous tests, with the performance data attached. This swipe file becomes an institutional memory that accelerates future testing.
Layer 5: CTA and Offer Testing
The CTA and offer are the final conversion lever in the creative. Even with a perfect hook and compelling visual, a weak or misaligned CTA suppresses conversions.
CTA variations to test:
| CTA Type | Example | Funnel Stage |
|---|---|---|
| Low-friction content | “Download the Free Guide” | Top of funnel |
| Social proof CTA | “Join 5,000+ brands — Get Started” | Mid-funnel |
| Urgency CTA | “Claim Your Free Audit — Only 10 Spots Left” | Bottom of funnel |
| Outcome-framed CTA | “Get My Free Campaign Analysis” | Bottom of funnel |
| Curiosity CTA | “See What We Found in 3 Minutes” | Top/mid-funnel |
Offer testing (separate from CTA wording):
- Free audit vs. free consultation vs. free report
- Discount vs. bonus vs. risk reversal
- Monthly pricing vs. annual pricing prominence
- Price shown vs. price hidden (test both — neither consistently wins)
How to Structure a Creative Test Properly
Running creative tests incorrectly is worse than not testing at all — it generates misleading data that leads to bad decisions. Here’s the methodology that produces reliable, actionable results.
The One-Variable Rule
The most common creative testing mistake is changing multiple elements at once. If you change the image, the headline, and the CTA simultaneously and performance improves, you have no idea which change drove the improvement. Test one variable at a time.
The exception: if you’re testing completely different creative concepts (angle + visual + copy, all different), treat them as separate concepts — not as variable tests. Concept tests tell you which direction to pursue; variable tests tell you how to optimize within that direction.
Statistical Significance: The Data Integrity Standard
A test result is only trustworthy when it reaches statistical significance — the threshold at which you can be confident the observed difference is real, not random noise.
Minimum requirements for valid creative test results:
- Sample size: Minimum 100 conversions per variant before declaring a winner
- Statistical confidence: 95% minimum (use tools like AB Testguide.com or Optimizely’s significance calculator)
- Test duration: Minimum 7 days to account for day-of-week variations in user behavior; 14 days is ideal
- Budget parity: Each variant must receive equal spend to prevent budget bias
The danger of ending tests early: In the first 2–3 days of a test, one variant will almost always appear to be winning due to random variation in early data. Teams that end tests early based on initial results are often wrong — and waste budget scaling a false winner.
The Testing Cadence
How often should you test? The answer depends on your monthly ad spend:
| Monthly Ad Spend | Recommended Testing Cadence | Active Tests at One Time |
|---|---|---|
| Under ₹1L/month | 1 test every 4 weeks | 1–2 |
| ₹1L–₹5L/month | 1–2 tests every 2 weeks | 2–4 |
| ₹5L–₹20L/month | Weekly testing cycles | 4–8 |
| ₹20L+/month | Continuous testing framework | 8–15+ |
At high spend levels, a performance marketing agency in Chennai running systematic creative tests typically improves ROAS by 15–40% within a quarter — purely through creative iteration, without changing targeting or budgets.
Platform-Specific Creative Testing Strategies
Meta Ads (Facebook and Instagram): The Creative Testing Powerhouse
Meta’s advertising platform is the most sophisticated environment for creative testing because of the volume of impressions available and the platform’s built-in A/B testing tools.
Meta’s native testing tools:
- A/B Test (Experiments tool): Officially Meta’s recommended testing method. Splits your audience randomly and ensures no overlap between test groups. Use for definitive tests.
- Dynamic Creative: Upload multiple headlines, images, and CTAs; Meta algorithmically tests combinations and allocates spend toward winners. Use for rapid exploration.
- Advantage+ Creative: Meta automatically applies creative enhancements (brightness adjustments, music, aspect ratio changes). Test with and without to see if automated enhancements help your specific creative.
Meta creative testing best practices:
- Create separate ad sets for each creative test (don’t test multiple creatives within one ad set — the algorithm favors one early and starves the others of data)
- Use Cost Cap or Bid Cap for bottom-of-funnel conversion tests — this normalizes spend allocation
- Test creative in the feed placement first; only expand to Reels, Stories, and Audience Network after identifying a winning concept
- Monitor frequency — when frequency exceeds 3–4 for the same audience, CTR decay signals ad fatigue regardless of creative quality
The Creative Refresh Rule: Meta data shows that ad creative begins losing effectiveness after being seen approximately 5,000–10,000 times by the same audience. Build a 30-day creative refresh cycle into your campaign management process.
Google Ads: Creative Testing Across Search, Display, and YouTube
Google’s ecosystem requires a different approach to creative testing because creative and targeting are more intertwined — search intent is part of the “creative equation.”
Google Search Ads — Responsive Search Ads (RSAs):
RSAs allow you to upload up to 15 headlines and 4 descriptions; Google’s machine learning tests combinations and serves the highest-performing assemblies.
RSA creative testing strategy:
- Pin headline 1 to your primary keyword/intent match (this stays constant)
- Test 3–4 different headline 2 variations: benefit, social proof, urgency, differentiator
- Test 2–3 description variations: objection removal, offer details, CTA
- Review the “Asset Performance” report in Google Ads — assets rated “Best” are your winners; assets rated “Poor” should be replaced
- Aim for an RSA Ad Strength of “Excellent” — Google’s research shows Excellent RSAs generate 6% more conversions on average than Good-rated ads
Google Display Ads:
- Test responsive display ads with 5 headlines, 5 descriptions, 5 images, and 2–3 logos
- Segment by placement type: Gmail vs. YouTube vs. third-party sites often perform very differently
- Use Customer Match audiences for display retargeting — creative for known customers should be different from prospecting creative
YouTube Ads — TrueView and Bumpers:
- The first 5 seconds of a skippable TrueView ad is your hook test — this is the only element viewers who skip will see
- Test bumper ads (6-second non-skippable) as brand recall reinforcement for audiences that have already seen your longer ads
- Use YouTube’s Video Experiments feature for head-to-head creative testing with statistical significance controls
Google Performance Max: Creative Testing in an Automated Environment
Performance Max (PMax) combines all Google inventory — Search, Shopping, YouTube, Display, Gmail, Discover — into a single campaign type driven by AI bidding and creative assembly.
Creative testing within PMax:
- Upload maximum creative assets: 15 headlines, 5 long headlines, 5 descriptions, 20 images, 5 logos, 5 videos
- Create multiple Asset Groups segmented by theme (e.g., one Asset Group per product category or audience segment)
- Monitor the Asset Group performance report — Google assigns performance tiers to individual assets
- Test different “final URL expansion” settings — allowing Google to send traffic to different pages can improve conversions but may reduce control over message match
PMax creative insight: Since PMax controls bidding and placement, creative differentiation between Asset Groups is the primary lever available to advertisers. Teams that treat all Asset Groups identically are leaving significant performance improvement on the table.
The Creative Testing Metrics That Actually Matter
Most teams track the wrong metrics. Here’s the hierarchy of metrics that should govern creative testing decisions.
Tier 1: Business Outcome Metrics (Primary)
These are the only metrics that ultimately matter:
- ROAS (Return on Ad Spend): Revenue ÷ Ad Spend. The north star metric for e-commerce and direct response campaigns
- CPA (Cost Per Acquisition): Total spend ÷ Number of conversions. North star for lead generation campaigns
- LTV:CAC Ratio: Lifetime Value ÷ Customer Acquisition Cost. The long-term health indicator — a ratio above 3:1 is generally sustainable
Tier 2: Diagnostic Metrics (Leading Indicators)
These metrics predict Tier 1 outcomes and diagnose where in the funnel creative is breaking down:
| Metric | What It Reveals | Benchmark Target |
|---|---|---|
| Hook Rate (3s video views ÷ impressions) | How effective is the first 3 seconds? | Above 30% for short video |
| Hold Rate (25% views ÷ 3s views) | Is the body of the ad retaining viewers? | Above 40% |
| CTR (Link Click-Through Rate) | Is the ad compelling enough to earn a click? | 1–3% for Meta cold audience |
| Landing Page CVR | Is the landing page fulfilling the ad’s promise? | Industry-dependent; 2–5% for lead gen |
| Cost Per Click (CPC) | Competitive efficiency of the ad | Lower = more compelling creative to the algorithm |
| CPM (Cost per 1,000 impressions) | Auction competitiveness | Lower CPM = better relevance score |
| Frequency | How many times the same person has seen the ad | Flag if above 3–4 for cold audiences |
Tier 3: Vanity Metrics (Caution Required)
These metrics feel meaningful but can mislead:
- Impressions: Volume without context. A creative with 1M impressions and 0.1% CTR is underperforming a creative with 100K impressions and 3% CTR.
- Video Views: Without defining “view” (3-second vs. 50% vs. complete), this metric is unreliable for comparison.
- Engagement Rate (Likes, Comments, Shares): Social engagement doesn’t always correlate with conversion. High engagement with low ROAS is a common pattern for viral but non-converting creatives.
A structured digital marketing agency in Chennai reports Tier 1 and Tier 2 metrics to clients — never letting Tier 3 metrics drive campaign decisions.
Building a Creative Testing System: The Operational Framework
Running individual tests is tactics. Building a testing system is strategy. The difference is compounding: a system turns every test into institutional knowledge that makes every future test smarter.
The Creative Testing Backlog
Maintain a prioritized backlog of creative hypotheses — ranked by estimated impact and ease of execution:
Hypothesis format:
“We believe that [changing X] will improve [metric Y] because [reason Z], and we’ll know this worked if [Y improves by N%].”
Example:
“We believe that leading with a customer testimonial video (vs. our current brand video) will improve CPA by 20% because trust is the primary purchase barrier for cold audiences, and we’ll know this worked if CPA drops below ₹800.”
Document every hypothesis before testing. This forces intellectual rigor and prevents ad hoc, intuition-driven testing.
The Creative Learning Repository
After every test concludes, document the results in a shared repository:
| Field | What to Record |
|---|---|
| Test Name | Descriptive title referencing what was tested |
| Hypothesis | The stated hypothesis before the test |
| Variable Tested | Exactly what changed |
| Winner | Which variant won |
| Performance Delta | % difference in primary metric |
| Statistical Confidence | % confidence level |
| Insight | What this tells us about the audience |
| Application | How this insight applies to future creative |
Over 6–12 months, this repository becomes one of the most valuable assets in your marketing operation — a documented map of your audience’s psychology, expressed in creative performance data.
The Creative Iteration Cycle
High-performing creative teams operate on a continuous cycle:
- Ideate — Generate hypotheses from the backlog, competitor research, customer interviews, and previous test learnings
- Brief — Write a precise creative brief specifying the variable being tested, the control creative, and the success metric
- Produce — Create the variant (minimum viable production quality — test concept before production value)
- Test — Run with proper statistical controls and minimum sample sizes
- Analyze — Assess results against the hypothesis; document in the learning repository
- Scale — Scale winners; kill losers immediately (don’t leave underperforming ads running “just in case”)
- Refresh — Plan the next iteration based on learnings from the winning variant
Cycle time: 2–4 weeks for the full loop at most spend levels.
Advanced Creative Testing Tactics Used by Top Performance Teams
Sequential Creative Testing (Funnel-Aware Messaging)
Rather than showing the same ad to everyone regardless of where they are in the buyer journey, sequential testing serves different creative based on what the user has already seen.
Example sequence for a digital marketing company in Chennai:
- Touchpoint 1 (Cold): Awareness video — “The 3 Reasons Chennai Businesses Waste Ad Budget”
- Touchpoint 2 (Engaged with video): Proof ad — “How We Helped [Client] Get 4x ROAS in 60 Days”
- Touchpoint 3 (Visited website): Retargeting — “Ready to See What’s Possible for Your Brand? Book a Free Audit.”
Each ad in the sequence builds on the previous one. Testing within each touchpoint (which awareness video, which proof case study, which retargeting offer) compounds the improvements across the entire funnel.
Creative Scoring and Tiering
Implement a scoring system to quickly classify creative performance and guide budget allocation:
| Tier | ROAS / CPA Performance | Action |
|---|---|---|
| Tier 1 (Winner) | 20%+ above target ROAS / below target CPA | Scale budget; protect from fatigue with rotation |
| Tier 2 (Performer) | Within 10% of target | Maintain; test iterations to improve |
| Tier 3 (Underperformer) | 10–30% below target | Pause; diagnose and iterate |
| Tier 4 (Failure) | 30%+ below target | Kill immediately; document learnings |
Reviewing this tiering weekly — and making budget decisions accordingly — ensures your spend is always concentrated on proven creative.
Competitor Creative Intelligence
Before developing new creative hypotheses, analyze what your competitors are running. Patterns in competitor creative reveal what’s working in your market — and where the gaps are.
Tools for competitor creative research:
- Meta Ad Library (free): See every active ad any brand is running on Meta platforms — including how long each ad has been running (longevity = profitability signal)
- Google Ads Transparency Center (free): See active Google ads by brand
- SpyFu: Analyze competitor PPC history and ad copy
- BigSpy: Multi-platform ad intelligence tool with creative performance signals
- SimilarWeb: Understand competitor traffic sources and ad channel mix
What to look for: Ads that have been running for 30, 60, or 90+ days in the Meta Ad Library are almost certainly profitable — brands don’t run losing ads that long. These are your competitors’ “controls” — the baseline you need to beat.
Micro-Testing Before Scale
Before committing significant budget to a new creative concept, run a micro-test at minimal spend to validate the hypothesis:
- Set a daily budget of ₹500–₹1,500 per variant
- Run for 5–7 days to collect preliminary data
- Use CPM-normalized CTR as the early signal (CPM x CTR = expected revenue per thousand impressions)
- Only move to full-scale testing if the micro-test shows a CTR improvement of 20%+ over the control
This approach reduces wasted test budget by filtering out obvious losers before they consume significant spend.
How Weboin Runs Creative Testing for Performance Clients
At Weboin, a specialized digital marketing company in Chennai, creative testing is embedded into every performance marketing engagement — not treated as an optional add-on. Our creative testing process operates on a documented four-week cycle that drives compounding ROAS improvements for every client.
The Weboin Creative Testing Stack:
Week 1 — Creative Audit and Hypothesis Development We audit the client’s existing creative library, analyze the Meta Ad Library and competitor landscape, interview key customer personas, and develop a prioritized testing backlog of 8–12 hypotheses. Every hypothesis is grounded in audience psychology — not aesthetic preference.
Week 2 — Production and Setup We brief and produce test variants at minimum viable production quality (concept validation before budget). We configure Meta Experiments or Google’s A/B testing tools with proper audience splits, budget parity, and statistical significance thresholds.
Week 3 — Test Execution and Monitoring Tests run without premature interference. We monitor for technical issues (disapprovals, tracking failures, delivery problems) but resist the temptation to optimize before statistical significance is reached.
Week 4 — Analysis, Documentation, and Scale Winners are documented in the creative learning repository. Insights are shared with the client and applied to the next cycle’s hypothesis development. Winning creative is scaled; losers are cut immediately.
As a full-service PPC agency in Chennai, Weboin manages this process across Meta, Google, YouTube, and LinkedIn — ensuring every rupee of client ad spend is informed by systematic creative intelligence rather than guesswork.
Client result pattern: Clients who commit to 3+ consecutive testing cycles with Weboin consistently see 30–60% ROAS improvement within 90 days — driven entirely by creative optimization, with targeting and budgets held constant.
Creative Testing Mistakes That Destroy ROAS
Even experienced teams make these errors. Recognizing them is the first step to eliminating them.
Mistake 1: Testing Too Many Variables at Once Changing the image, headline, and CTA in the same test produces uninterpretable results. One variable per test. Always.
Mistake 2: Ending Tests Before Statistical Significance Early leaders often lose by final count. Premature decisions waste budget on false winners. Commit to minimum 100 conversions per variant.
Mistake 3: Scaling Losing Creative “Just to See” If a creative loses with statistical confidence at test spend, scaling it won’t change the outcome — it just burns more budget. Kill losers decisively.
Mistake 4: Ignoring Ad Fatigue A creative that worked brilliantly in month 1 will degrade as the same audience sees it repeatedly. Track frequency and rotate creative proactively — before fatigue shows up in ROAS.
Mistake 5: Testing Without a Hypothesis “Let’s try a video” is not a hypothesis. “We believe a testimonial video will reduce CPA by 25% because social proof addresses the primary purchase objection” is. The hypothesis disciplines the test and makes the result meaningful.
Mistake 6: Treating All Platforms the Same Creative that works on Meta often fails on LinkedIn or YouTube because audience context and behavior are fundamentally different. Platform-specific creative testing is not optional for multi-channel campaigns.
Mistake 7: Not Connecting Creative Tests to Business Outcomes Testing for CTR improvement without connecting to ROAS or CPA can lead you to optimize for clicks rather than revenue. Always tie creative tests to Tier 1 business outcome metrics.
A 90-Day Creative Testing Roadmap
For teams launching a structured creative testing program from scratch:
Days 1–30: Baseline and First Test
- Audit all existing creative; document current ROAS and CPA benchmarks
- Set up creative performance tracking in Meta Ads Manager and Google Ads
- Develop 8–10 hypotheses based on audience research and competitor analysis
- Run your first angle test: 4–5 message angles, static format, identical visual treatment
- Establish your creative learning repository
Days 31–60: Iteration and Format Testing
- Scale the winning angle from Month 1
- Run hook test within the winning angle (3–4 hook variations for video)
- Run format test: video vs. static vs. carousel for the winning angle and hook
- Begin building UGC-style variants if in D2C or consumer category
- Run micro-tests on 2–3 new concepts from the hypothesis backlog
Days 61–90: Scale and System
- Scale Tier 1 creative across all relevant placements
- Run visual element test within the winning format
- Run CTA/offer test for bottom-of-funnel campaigns
- Review and document all learnings; build next quarter’s hypothesis backlog
- Implement creative refresh plan for any creative approaching 4+ frequency
Frequently Asked Questions About Creative Testing for ROAS
With a structured testing program, most brands see measurable ROAS improvement within 30–45 days of the first test cycle. Significant improvement (20–40%) typically accumulates over 60–90 days of consistent testing.
At modest spend levels (under ₹2L/month), test 2–3 variants at a time to concentrate impressions and reach significance faster. At higher spend levels, 4–8 concurrent variants is manageable.
Yes — at least once per campaign. The winning format is audience-specific and can't be assumed. Many B2B audiences respond better to static; many consumer audiences respond better to UGC video. Test to know, don't assume.
You need enough spend to generate 100 conversions per variant. If your CPA is ₹1,000, you need ₹1 lakh per variant to reach significance. At lower conversion volumes, use CTR as a proxy metric — but treat conclusions as directional, not definitive.
Absolutely — and the principle is even more important in B2B because CPCs are higher (every click costs more) and audience sizes are smaller (inefficiency is more expensive). B2B creative testing focuses more on angle and copy than on visual format.
Creative and audience are interrelated — a winning creative for a cold audience may underperform for a retargeting audience, and vice versa. For large-scale campaigns, test creative within specific audience segments, not across combined audiences.
Final Thought: Creative Testing Is the Highest-Leverage Activity in Paid Media
Every other paid media optimization — bidding strategy, audience targeting, budget allocation, placement selection — improves ROAS at the margins. Creative testing improves it at the core, because creative is what the audience actually experiences.
The brands that consistently achieve top-quartile ROAS aren’t necessarily running bigger budgets or accessing better audiences. They’re running better creative — and they know it’s better because they tested it against the alternative.
Build the system. Trust the data. Kill what doesn’t work. Scale what does. Repeat.
Whether you’re managing campaigns in-house or working with a specialist digital marketing agency in Chennai like Weboin, this framework gives you everything you need to turn creative testing from a tactic into a compounding competitive advantage.
About Weboin: Weboin is a full-service performance marketing agency in Chennai offering paid media management, creative strategy, PPC management, SEO, and conversion optimization. As a trusted PPC agency in Chennai, Weboin helps brands across industries build systematic creative testing programs that drive measurable, compounding ROAS improvements — backed by data, built for scale.

No comment yet, add your voice below!